Vancouver startup EstateBlock.com has created a search engine that helps parents buy homes near top rated schools.

It’s a nightmare scenario for any home buying parent. It’s almost school time for the kids, but the family is still looking for a new place to live.  After weeks or sometimes months of endless searching, they think they’ve found the perfect home. They did the home tours, travelled around with an agent from one neighbourhood to another, and finally seem to have found what they want.

Not too big or too small, the new home has every feature on their list, and the price is within their budget. Finally, they close on the house and the whole family moves in.


Only later, after the kids are in school, do the problems arise. What seemed like a nice neighbourhood, turns out to have a not-so-nice school district. No parent wants this to happen, but how can they be sure their new home is right in the first place?


The EstateBlock.com website allows users to enter a search for new homes to buy, but unlike many other real estate websites on the internet today, the site gives a lot more information in its results.

“Parents want more information when buying a home for their family, not less,” said Vadim Marusin, one of the startup’s founders.  “This is where the real power of our search engine comes in.”


“Anyone can search and in a few moments know exactly all the information they could want about a specific neighbourhood. The results can be filtered to give exactly the details that a person needs.”

“For example, the search engine can show how good a school district is near a home, or how much crime is in the area” among dozens of other options, he said.

For parents, the benefits are obvious. Instead of days of research about school districts and looking for ratings and boundaries, they can instead have that information in moments.


“Imagine easily finding a home in an excellent public school district, versus moving to another district and now having to pay for a private school,” he said. “That’s our goal, to help every family get exactly the home they want.”

Sick of Vancouver RE prices? Best Houses in Cloverdale,BC under $500K (Handpicked by EstateBlock.com)

What you can buy in Cloverdale, BC under $5oo,000 if you are looking for a house? We scanned all database and handpicked 5 best properties specifically for you. Enjoy!

1. 6393 190th Street, Surrey, BC, MLS# F1316457


Cozy rancher featuring 4 spacious bedrooms, 2 full baths, A/C and more.


This rancher on a massive lot features a great floor plan; off the entrance walk into the combo dining-living area with great bay windows. Next, off the bright kitchen you have a family room with sliding door to your hot tub and manicured backyard. It features a new deck and plenty of space for the kids or to entertain.

Back inside you will find 4 bedrooms, and 2 full baths, with the master featuring an ensuite and walk-in closet. The double garage offers plenty of space for your vehicles or toys.


The beautiful front yard boasts plenty of parking and a BONUS area to park your RV/Trailer on the side of the home. Call today to schedule your viewing!


Listed by: Lighthouse Realty Ltd.


2. 6733 185a Street, Surrey, BC, MLS# F1318792


The well maintenance Fraserville model. Renovated 2013. 2 storey PLUS finished basement. 4 bedrooms, 3 1/2 baths, 1 natural gas fireplaces. 1 carport from laneway and lots of visitor parking.


Quiet and quaint neighborhood. Walking to Hillcrest Elementary School and Pacific Academy nearby, perfect for your kids.


Do not miss your really AFFORDABLE price.

Listed By: Royal Pacific Realty Corp.


3. 6513 184a Street, Surrey, BC, MLS# F1310256


Park lane built 4 bedroom 4 bathroom 2 storey home with fully finished basement.


Corner lot with rear lane access, close to shopping, recreation, schools and transport. Great plan for the family, and could easily be suited for extended family down with separate entrance.


Covered front porch. Loads of storage space. Fabulous value at this price. Too many features to list, call for more information and appointments to view.


Listed By: Prudential Power Play Realty


4. 18918 60 Ave, Surrey, BC, MLS# F1316995


QUICK POSSESSON POSSIBLE! Very well kept and updated home on large southern exposed lot with RV parking.


Upgrades include: newer roof, flooring, stainless steel appliances, newer paint, the list goes on. Great floor plan with kitchen and family room looking over sunny fully fenced backyard. Call today!


Listed By: Re/Max Treeland Realty


5. 6179 192nd Street, Surrey, BC, MLS# F1312566


Bright basement entry in central location with view of Mt. Baker. Private hedge on 192.


Some updates include neutral paint, carpet, doors. Lots of notice preferred. Do not enter yard without appt. Dog on Property.


Listed By: Homelife Benchmark Rlty.

Sick of Vancouver RE prices? We Hand-picked 5 best houses in Maple Ridge under $400,000. Enjoy!

In Previous post we hand-picked 5 best houses in Cloverdale, BC under $500,000.
In this post we found 5 best houses in Maple Ridge under $400,000! Enjoy!

1. 23631 Dewdney Trunk Road, Maple Ridge, BC, MLS# V1011371

Over 2200 sq ft of finished living space in this well maintained 2 storey with full basement.


9′ ceilings, family room off kitchen (currenty used as dining space), spacious & bright living/dining room, master bedroom with full ensuite & walk in closet. Lots of parking in back with lane access.

Rear fenced yard to keep kids & pets safe & features patio & separate entrance to downstairs suite.


Listed by: Coldwell Banker Tri-tel Realty


2. 13011 250th Street, Maple Ridge, BC, MLS# V997631


Court Ordered Sale – Alouette Estates. 1.77 acre property backing directly on steep ravine, cree, & forest. 15 yr old, 2 storey home featuring 4 bedrooms plus family room up, located on quiet C-D-S.


Home floor plan is extremely narrow & requires updating throughout. 77,406 square foot lot, but only 8000 square foot building platform. Absolutely no room bo build larger home, shop or out buildings.


Property is SOLD on ‘as is, where is’ basis. Now available to show.

Listed By: Re/max 2000 Realty


3. 24252 102b Ave, Maple Ridge, BC, MLS# V1012117


ABSOLUTELY ALBION! ……………a family community with park and play structure, pizza and video store for movie night AND a gourmet coffee shop…..all just blocks from elementary school and a short drive to countless amenities.


Your family will approve of this 2324 sf 3 level home offering 4 bdrms PLUS den ~ 4 baths, master enjoys a roomy walk-in and private bath with soaker tub and separate shower, well lit and well appointed kitchen with island/breakfast bar for quick meals, a fully finished basement where movie night will be a hit in the games room!


FAMILY FRIENDLY ~ FAMILY FUNCTIONAL


Listed By: Royal Lepage – Brookside Rlty.


4. 24272 102nd Ave, Maple Ridge, BC, MLS# V979073


Gorgeous corner lot custom built home with plenty of nice features such as an added granite island in the kitchen, real engineering hardwood floor & fresh professional paint.


The crawl space is excellent for extra storage or cold room. Spectacular floor plan with 3 bedrooms, 2.5 baths plus spacious open concept main floor living space & kitchen. Ready to move-in condition or investment.


A must see! Close to Albion Elementary and Samuel Robertson Secondary and French Immersion. Quick access to everything. Got a home to trade? No problem, trades welcome! Call for details.


Listed By: New World Realty Ltd.


5. 24360 102a Ave, Maple Ridge, BC, MLS# V1020006


FALCON LANDING in ALBION invites you to settle into this 4 BDRM/4BATH 2 storey home w/full, professionally finished walk-out bsmnt in family oriented neighbourhood.


9 ft ceilings, easy-care laminate flooring, large island, S/S appl and plenty of counter/cabinet space in the eat-in kitchen, vaulted ceiling in master plus W/I closet and private 4 pc bath, Jack & Jill bath for the upper bdrms, spacious rec room and 4th bdrm in bsmnt…… ideal for family movie night!


Minutes to SRT, Albion Elementary, and W C Express station. Shopping and lots of recreation just a short drive away……COME HOME TO FALCON LANDING….


Listed By: Royal Lepage – Brookside Rlty.

Vancouver Sees a Continual Decline in Home Sales

For the third consecutive month, national home sales have declined for July 2016. Sales activity has come in at 3.9 percent below the record set in April 2016, according to statistics released by the Canadian Real Estate Association.

While Great Vancouver and the Fraser Valley led the pack for sales activity being decreased, activity was down in more than half of all markets for July when compared with the previous month’s records. Transactions for Greater Vancouver and the Fraser Valley had peaked in February of this year, and have continually dropped off by 21.5 percent in Greater Vancouver and 28.8 percent in the Fraser Valley. These sales declines reflect the sales across much of the nation; and are not subject to only these areas.

Actual sales activity (not adjusted for season) was down by 2.9 percent year-over-year for July 2016 when comparing to July 2015 –this marks the first year-over-year decline since January of 2015. This is also the largest year-over-year decline we have seen since April 2013.

In almost sixty percent of all Canadian markets, sale levels were down this month – the trend led by Greater Vancouver, Fraser Valley, Calgary and Edmonton. In Vancouver, the number of newly listed homes actually rose by 1.2 percent when compared for the previous month. Less than half of all local markets experienced the same rise in newly listed homes.

Prices of homes have also grown substantially. The biggest rises in year-over-year house prices came from two-storey single family homes (increased by 15.9 percent), townhouses/rowhomes (increased by 15.3 percent), one-storey single family homes (increased by 14.3 percent), and apartment units (increased by 11.1 percent).

With all of these numbers into consideration, it is no shock that home sales are declining considerably, with a lack of inventory and decrease in affordability being the top reasons.

Economic Concerns with House Sale Decline

Speculation is on the rise that the B.C. Liberal Government will likely take blame for falling house prices in the next year, a report says.

The report, which was conducted by Capital Economics, states that the likelihood of the blame falling on the Liberals’ decision to impose a foreign buyer tax on the housing market is high, despite the fact that the trend in Vancouver’s housing market began to change well before the foreign buyer tax took effect. The report expects to see house price growth around, or possible below, zero percent by May of 2017. The B.C. government will likely take the brunt of the blame for this.

August 2016 is so far showing a great decline in housing purchases. In Greater Vancouver, home sales were down for the first two weeks of August by 85 percent when compared to the same two-week period of 2015. In West Vancouver specifically, home sales were down by 94 percent – a total of three home sales in the first half of August 2016. For reference, there were 52 sales in the first half of August 2015.

Much of this decline in home sales comes from the higher end of the market where the top-market homes have been taking considerably longer to sell. In the lower-range housing market, home sales continue to be sold quicker than previously. In addition, the lower average selling price that has been documented in recent months might not be an indication of the market declining as a whole; it could be an indicator only of the types and prices of home sales.

In British Columbia, real estate and construction of homes account for more than a quarter of the province’s economy. The slowdown in housing sales raises some concern for a great decline in the economy of B.C. While this comes at the same time as the new foreign tax, experts say that the downturn began well before the crackdown on foreign buyers. West Vancouver home sales, for instance, fell by 38 percent in June, whereas the new tax was not introduced until the end of July.

Do you think there will be a downturn in our economy? Will the Liberals take the blame?

Please tell us what you think!

Housing Bubble: Foreign Buyers May Not Be the Only Problem

Capital Economics published a letter earlier this month explaining their distaste for the notion that foreign buying is Vancouver’s real problem, blaming politicians for using this as a “blame game”, and one that they have seen time and time again.  The letter offers a handful of alternative ideas, and some food for thought.

According to the letter, Vancouver actually had a relatively low percent of foreign purchases when compared to other similar metros: Florida had 22 percent foreign purchases in 2015, and 16 percent in California – Vancouver only had 10 percent. The letter notes that price increases only went up by 7 percent last year in Miami, and 10 percent in San Francisco.

Capital Economics states that they believe the housing problem is instead caused by low interest rates and irresponsible lending in Vancouver and surrounding areas. The report does acknowledge that the low Canadian dollar has made Vancouver a more viable option for foreign purchase, and therefore doesn’t disregard the idea completely – but it rejects the notion that foreign purchase is the sole proprietor for the current housing bubble.

When looking at loan-to-income ratios in Vancouver, the report found that nearly 33 percent of insured mortgages had a ratio of more than 450 percent. In the past 12 months we have seen a further decline in interest rates, and therefore lending standards being relaxed even further. The report states that this, not foreign purchasing, is the issue at hand.

The letter expresses concern for the future of Vancouver’s economy, stating that if the new 15 percent tax on foreign purchasers scares those purchasers away from Vancouver, a significant drop in the real estate market could lead to a massive impact on the economy.

Let us know your thoughts in the comments below.

Chinese Buyers & House Auctions: A Peek into Australia’s Real Estate Market

It’s a topic we know all too much about right now: foreign investment in the real estate market – especially with Chinese purchasers. However, the scene in Australia is a little different from the one in Vancouver.

Chinese investment in Australia’s housing market has quadrupled from 2013 to 2015: soaring to $24.3 billion from $5.9 billion.  Chinese buyers are dominating the housing auctions in suburban Australia – and in many such auctions it has become increasingly rare to see bidders of other nationalities.

However, it is not just offshore investors who are dominating the market. Australian real estate companies claim that the largest percentage of Chinese buyers whom attend their auctions are either Australian citizens or permanent residents.

In these house auctions, it’s common for the incredibly bidding-savvy Chinese buyers to do well. The bids all come down to readiness; how much homework you have done; and how much heart you put into the bid, according to one auction-style home purchaser. He recommends not to bother bidding near the beginning of the auction, so as to not “waste breath.” He claims you will know who you are really bidding against near the finish line.

Another bidder, one of dozens on the four bedroom house that ended up selling for $1.8 million, was hoping to move his growing family out of their cramped apartment. He, like many of the bidders, has been searching for a home for well over two months – but it all comes down to who wants it the most with an auction-style market.

What do you think about buying a house in an auction? Would it make the process easier or more difficult? We are curious to know your opinions!

Local Government Regulations Worsening Canada’s Housing Affordability

The rising prices for new homes in Canada’s most costly cities are a result of the government’s housing regulations, according to policy-research group C.D. Howe Institute.

The institute’s latest report, released Tuesday, said that single-family detached houses across Canada were subject to a steep increase in prices, due to factors such as zoning rules, delays on permit approvals and municipal development fees.
Eight areas of focus are contained in the study – including Toronto, Calgary, Vancouver and Ottawa-Gatineau — where new-home prices are more than 20 percent higher than the cost of construction.

From 2007 to 2016, barriers to homebuilding added an average of $229,000 to the price of a house located in those regions.
The greatest impact was in Vancouver, where buyers paid an average of $644,000 extra for a new house, which works out to about half of the total price. That proportion is equivalent to what other studies have found for Manhattan, C.D. Howe said.
Excessive government regulations are to blame for barriers inhibiting new construction, the group said in the report. It goes on to explain that housing markets function best when the market price of housing is very close to the feasible cost of constructing it, so when prices exceed this construction cost, it’s generally due to extra factors such as government interference.
Prices for homes in Vancouver and Toronto have surged 81 percent and 64 percent, respectively, over the past five years, according to March data from the Canadian Real Estate Association.

The demand outpaces supply in both cities, where housing prices have stayed consistently high despite government policies to tame the increases, such as taxes on foreign buyers and stricter mortgage rules.
When barriers arise to building homes, the cost of existing homes goes up, as buyers are left to compete for the housing that is available. The C.D. Howe study found that barriers to development have added more than $100,000 on average to prices for both new and resale homes in some parts of Ontario.

Cities and provinces have taken some initiatives to assist with housing affordability, such as new taxes, however, further measures can still be taken to make it easier to develop land. Two such changes are that zoning laws could be simplified and developer fees could be reduced. We must ask what the true motives are behind the actions taken by the government when it comes to this issue of affordable housing.

CONDOS Benchmark Price April 2018, 1 month change, % (HEAT MAP)

Top 10 Neighbourhoods Where Condos Prices Have Risen the Most Last Month.

1. 12.38% – Garibaldi Estates, Squamish
2. 12.08% – Valleycliffe, Squamish
3. 9.83% – Downtown SQ, Squamish
4. 7.97% – Brighouse, Richmond
5. 7.08% – Otter District, Langley
6. 6.48% – Boyd park, Richmond
7. 6.44% – Seafair, Richmond
8. 6.23% – Aldergrove Langley, Langley
9. 6.06% – Abbotsford East, Abbotsford
10. 6.03% – Maillardville, Coquitlam

Top 10 Neighbourhoods Where Condos Prices Have Risen the Least or Descended Last Month.

1. -3.96% – Shaughnessy, Vancouver West
2. -3.64% – Southlands, Vancouver West
3. -3.32% – Killarney VE, Vancouver East
4. -2.80% – Dunbar, Vancouver West
5. -2.67% – Kerrisdale, Vancouver West
6. -2.61% – Quilchena, Vancouver West
7. -2.36% – Fraser VE, Vancouver East
8. -2.32% – College Park PM, Port Moody
9. -2.29% – Highgate, Burnaby South
10. -2.26% – Metrotown, Burnaby South

9 HEAT MAPS for Greater Vancouver April 2018 Real Estate Market Prices & Trends

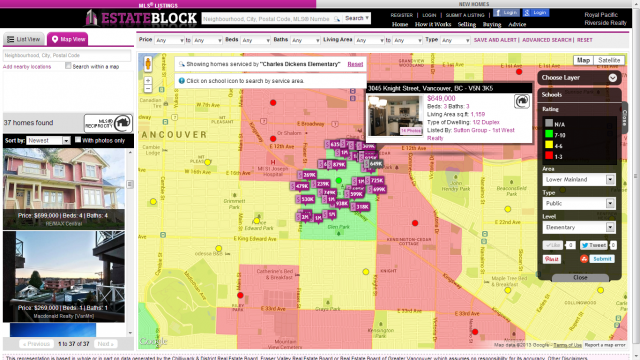
We are EstateBlock.com. One of the most innovative real estate search engines in Canada serving BC, Canada.
We spent couple days to make 9 super detailed heat maps of Lower Mainland Real Estate Prices. We broke it down to neighbourhoods and type of property so everybody can see what happened with their home prices. Enjoy!

>

Top 10 Most Expensive Neighbourhoods in Lower Mainland for Single Family Homes

1. $6,461,800 – Whitby Estates, West Vancouver
2. $5,741,100 – Shaughnessy, Vancouver West
3. $5,663,200 – University VW, Vancouver West
4. $5,176,100 – Canterbury WV, West Vancouver
5. $4,516,600 – Westhill, West Vancouver
6. $4,204,700 – Chartwell, West Vancouver
7. $4,094,900 – South Granville, Vancouver West
8. $4,000,300 – Quilchena, Vancouver West
9. $3,974,600 – Altamont, West Vancouver
10. $3,792,700 – Arbutus, Vancouver West

Top 10 Least Expensive Neighbourhoods in Lower Mainland for Single Family Homes

1. $476,500 – Dewdney Deroche, Mission
2. $529,900 – Pender Harbour Egmont, Sunshine Coast
3. $539,900 – Bridgeview, North Surrey
4. $565,800 – Sechelt District, Sunshine Coast
5. $589,300 – Halfmn Bay Secret Cv Redroofs, Sunshine Coast
6. $592,600 – Durieu, Mission
7. $678,700 – Gibsons & Area, Sunshine Coast
8. $680,900 – Mission BC, Mission
9. $697,100 – Hatzic, Mission
10. $720,800 – Roberts Creek, Sunshine Coast

Top 10 Neighbourhoods Where Single-Family Homes Prices Have Risen the Most Last Month.

1. 6.28% – Port Moody Centre, Port Moody
2. 5.70% – Parkcrest, Burnaby North
3. 5.27% – Chineside, Coquitlam
4. 5.19% – Northyards, Squamish
5. 5.18% – Hazelmere, White Rock
6. 5.05% – Brentwood Park, Burnaby North
7. 4.99% – Fort Langley, Langley
8. 4.93% – Bradner, Abbotsford
9. 4.84% – Central BN, Burnaby North
10. 4.82% – Sullivan Heights, Burnaby North

Top 10 Neighbourhoods Where Single-Family Homes Prices Have Risen the Least or Descended Last Month.

1. -5.30% – University VW, Vancouver West
2. -5.28% – Canterbury WV, West Vancouver
3. -4.72% – McLennan North, Richmond
4. -4.37% – Point Grey, Vancouver West
5. -4.36% – Elgin Chantrell, White Rock
6. -4.33% – Garden City, Richmond
7. -4.26% – Woodwards, Richmond
8. -3.97% – Altamont, West Vancouver
9. -3.96% – Mount Pleasant VW, Vancouver West
10. -3.72% – West Cambie, Richmond

Top 10 Neighbourhoods Where Single-Family Homes Prices Have Risen the Most Last Year.

1. 23.58% – Langley City, Langley
2. 22.40% – Northeast, Maple Ridge
3. 22.03% – Central Abbotsford, Abbotsford
4. 21.30% – Poplar, Abbotsford
5. 21.27% – Whalley, North Surrey
6. 21.19% – Sumas Mountain, Abbotsford
7. 20.80% – Pender Harbour Egmont, Sunshine Coast
8. 20.80% – Sumas Prairie, Abbotsford
9. 20.50% – Silver Valley, Maple Ridge
10. 20.40% – Sechelt District, Sunshine Coast

Top 10 Neighbourhoods Where Single-Family Homes Prices Have Risen the Least or Descended Last Year.

1. -12.40% – South Granville, Vancouver West
2. -8.35% – Elgin Chantrell, White Rock
3. -7.20% – Cypress, West Vancouver
4. -7.00% – MacKenzie Heights, Vancouver West
5. -7.00% – Kitsilano, Vancouver West
6. -5.80% – Kerrisdale, Vancouver West
7. -5.50% – University VW, Vancouver West
8. -5.00% – Terra Nova, Richmond
9. -4.50% – West Bay, West Vancouver
10. -4.20% – Sunnyside Park Surrey, White Rock

Top 10 Most Expensive Neighbourhoods in Lower Mainland for Condos

1. $3,214,500 – Cypress Park Estates, West Vancouver
2. $1,514,800 – Panorama Village, West Vancouver
3. $1,512,400 – Dundarave, West Vancouver
4. $1,332,600 – Park Royal, West Vancouver
5. $1,274,300 – Capilano NV, North Vancouver
6. $1,147,700 – Quilchena, Vancouver West
7. $1,145,300 – Edgemont, North Vancouver
8. $1,122,500 – Oakridge VW, Vancouver West
9. $1,063,300 – Coal Harbour, Vancouver West
10. $1,021,600 – South Granville, Vancouver West

Top 10 Least Expensive Neighbourhoods in Lower Mainland for Condos

1. $263,500 – Granville, Richmond
2. $276,600 – Central Coquitlam, Coquitlam
3. $285,900 – Otter District, Langley
4. $286,900 – Annieville, N. Delta
5. $295,400 – West Central, Maple Ridge
6. $302,400 – Cedar Hills, North Surrey
7. $324,000 – South Arm, Richmond
8. $324,100 – College Park PM, Port Moody
9. $330,400 – West End NW, New Westminster
10. $342,100 – Abbotsford West, Abbotsford

Top 10 Neighbourhoods Where Condos Prices Have Risen the Most Last Month.

1. 12.38% – Garibaldi Estates, Squamish
2. 12.08% – Valleycliffe, Squamish
3. 9.83% – Downtown SQ, Squamish
4. 7.97% – Brighouse, Richmond
5. 7.08% – Otter District, Langley
6. 6.48% – Boyd park, Richmond
7. 6.44% – Seafair, Richmond
8. 6.23% – Aldergrove Langley, Langley
9. 6.06% – Abbotsford East, Abbotsford
10. 6.03% – Maillardville, Coquitlam

Top 10 Neighbourhoods Where Condos Prices Have Risen the Least or Descended Last Month.

1. -3.96% – Shaughnessy, Vancouver West
2. -3.64% – Southlands, Vancouver West
3. -3.32% – Killarney VE, Vancouver East
4. -2.80% – Dunbar, Vancouver West
5. -2.67% – Kerrisdale, Vancouver West
6. -2.61% – Quilchena, Vancouver West
7. -2.36% – Fraser VE, Vancouver East
8. -2.32% – College Park PM, Port Moody
9. -2.29% – Highgate, Burnaby South
10. -2.26% – Metrotown, Burnaby South

Top 10 Neighbourhoods Where Condos Prices Have Risen the Most Last Year.

1. 55.70% – Central Abbotsford, Abbotsford
2. 55.53% – Annieville, N. Delta
3. 54.31% – Bear Creek Green Timbers, Surrey
4. 53.66% – Cedar Hills, North Surrey
5. 53.10% – Northwest Maple Ridge, Maple Ridge
6. 52.59% – Langley City, Langley
7. 51.90% – West Central, Maple Ridge
8. 51.20% – East Central, Maple Ridge
9. 50.85% – West Newton, Surrey
10. 50.38% – East Newton, Surrey

Top 10 Neighbourhoods Where Condos Prices Have Risen the Least or Descended Last Year.

1. 10.80% – False Creek, Vancouver West
2. 12.90% – Downtown VW, Vancouver West
3. 13.00% – Mount Pleasant VE, Vancouver East
4. 13.40% – Ladner Elementary, Ladner
5. 13.50% – Steveston South, Richmond
6. 14.10% – Oakridge VW, Vancouver West
7. 14.90% – Coal Harbour, Vancouver West
8. 15.00% – South Cambie, Vancouver West
9. 15.80% – South Granville, Vancouver West
10. 16.10% – Quilchena, Vancouver West

Top 10 Most Expensive Neighbourhoods in Lower Mainland for Townhomes

1. $2,469,000 – Shaughnessy, Vancouver West
2. $1,918,100 – South Cambie, Vancouver West
3. $1,856,500 – Coal Harbour, Vancouver West
4. $1,788,600 – University VW, Vancouver West
5. $1,783,200 – Yaletown, Vancouver West
6. $1,648,900 – Oakridge VW, Vancouver West
7. $1,590,500 – Kerrisdale, Vancouver West
8. $1,586,100 – Quilchena, Vancouver West
9. $1,274,400 – Mount Pleasant VW, Vancouver West
10. $1,246,100 – Cambie, Vancouver West

Top 10 Least Expensive Neighbourhoods in Lower Mainland for Townhomes

1. $362,900 – Central Abbotsford, Abbotsford
2. $384,100 – Abbotsford West, Abbotsford
3. $385,100 – Abbotsford East, Abbotsford
4. $420,000 – Aldergrove Langley, Langley
5. $449,400 – Mission BC, Mission
6. $467,600 – Boyd park, Richmond
7. $470,900 – Annieville, N. Delta
8. $476,600 – Central Coquitlam, Coquitlam
9. $478,000 – Maillardville, Coquitlam
10. $480,300 – Langley City, Langley

Top 10 Neighbourhoods Where Townhomes Prices Have Risen the Most Last Month.

1. 13.36% – Northyards, Squamish
2. 12.77% – Dentville, Squamish
3. 9.12% – Garibaldi Highlands, Squamish
4. 8.58% – Brackendale, Squamish
5. 7.33% – Garibaldi Estates, Squamish
6. 7.21% – Shaughnessy, Vancouver West
7. 6.92% – Langley City, Langley
8. 6.45% – Downtown SQ, Squamish
9. 6.37% – Central Abbotsford, Abbotsford
10. 6.03% – King George Corridor, White Rock

Top 10 Neighbourhoods Where Townhomes Prices Have Risen the Least or Descended Last Month.

1. -4.02% – Coal Harbour, Vancouver West
2. -3.55% – Burnaby Hospital, Burnaby South
3. -2.20% – College Park PM, Port Moody
4. -1.68% – Abbotsford West, Abbotsford
5. -1.52% – Brighouse South, Richmond
6. -1.41% – Coquitlam East, Coquitlam
7. -1.18% – Maillardville, Coquitlam
8. -0.94% – Central Coquitlam, Coquitlam
9. -0.85% – Yaletown, Vancouver West
10. -0.74% – Guildford, North Surrey

Top 10 Neighbourhoods Where Townhomes Prices Have Risen the Most Last Year.

1. 40.31% – Central Abbotsford, Abbotsford
2. 32.06% – Guildford, North Surrey
3. 31.20% – Cottonwood MR, Maple Ridge
4. 30.60% – Collingwood VE, Vancouver East
5. 30.13% – Poplar, Abbotsford
6. 29.98% – East Newton, Surrey
7. 29.93% – Aldergrove Langley, Langley
8. 29.90% – Southwest Maple Ridge, Maple Ridge
9. 29.80% – Victoria VE, Vancouver East
10. 29.70% – Brackendale, Squamish

Top 10 Neighbourhoods Where Townhomes Prices Have Risen the Least or Descended Last Year.

1. 4.90% – Kitsilano, Vancouver West
2. 5.10% – Oakridge VW, Vancouver West
3. 5.70% – University VW, Vancouver West
4. 5.80% – Kerrisdale, Vancouver West
5. 6.30% – Cambie, Vancouver West
6. 6.40% – Point Grey, Vancouver West
7. 6.60% – False Creek, Vancouver West
8. 6.90% – Steveston Village, Richmond
9. 7.10% – Coal Harbour, Vancouver West
10. 7.90% – Boyd park, Richmond


Greater Vancouver April 2018 Market Update
April saw more home sellers than buyers in the Metro Vancouver* housing market.

Residential property sales in the region totalled 2,579 in April 2018, a 27.4 percent decrease from the 3,553 sales recorded in April 2017, and a 2.5 percent increase compared to March 2018 when 2,517 homes sold, according to the Real Estate Board of Greater Vancouver. Last month’s sales were 22.5 percent below the 10-year April sales average.
Changing market conditions are evident, this is due in part to the new mortgage requirements implemented by the federal government which have diminished home buyer’s purchasing power.

A total of 5,820 detached, attached and apartment properties were newly listed for sale on the Multiple Listing Service® (MLS®) in Metro Vancouver in April 2018, representing an 18.6 percent increase compared to the 4,907 homes listed in April 2017 and a 30.8 percent increase compared to March 2018 when 4,450 homes were listed.
Currently, the number of properties listed for sale on the MLS® system in Metro Vancouver is 9,822, a 25.7 percent increase compared to April 2017 (7,813) and a 17.2 percent increase compared to March 2018 (8,380).

For April 2018, the sales-to-active listings ratio is 26.3 percent for all property types. By property type, the ratio is 14.1 percent for detached homes, 36.1 percent for townhomes, and 46.7 percent for condominiums.
Generally, downward pressure on home prices occurs when the ratio dips below the 12 percent mark for a sustained period, according to analysts, while home prices often experience upward pressure when it surpasses 20 percent over several months.
The MLS® Home Price Index composite benchmark price for all residential properties in Metro Vancouver is currently $1,092,000. This represents a 14.3 percent increase over April 2017 and a 0.7 percent increase compared to March 2018.
There were 807 sales of detached properties in April 2018, which was a 3.4 percent decrease from the 1,211 detached sales recorded in April 2017. The benchmark price for detached properties is $1,605,800. This represents a 5.1 percent increase from April 2017 and a 0.2 percent decrease compared to March 2018.
Sales of apartment properties decreased 24 percent from last year, reaching 1,308 in April 2018. The benchmark price of an apartment property is $701,000. This represents a 23.7 percent increase from April 2017 and a 1.1 percent increase compared to March 2018.
Sales of attached properties in April 2018 totalled 464, a 25.2 percent decrease compared to the 620 sales in April 2017. The benchmark price of an attached unit is $854,200. This represents a 17.7 percent increase from April 2017 and a 2.3 percent increase compared to March 2018.
In the Fraser Valley, buying activity remained modest throughout the month of April despite a bump in inventory across all three major residential types.

The Fraser Valley Real Estate Board saw 1,708 sales across all property types in April 2018, a decrease of 23.4 percent compared to the 2,230 sales in April of last year, and a 2.6 percent increase compared to the 1,664 sales in March 2018.

Of those sales, 413 were townhomes and 498 were apartments, together making up 53 percent of all transactions in April.
At the end of April 5,667 listings remained active, an increase of 18.2 percent month over month, and 15.3 percent when compared to April 2017.
3,429 new listings went up in April, a 19.7 percent increase from March 2018’s 2,865 new listings, and a 16.2 percent increase compared to April 2017.
The average number of days to sell an apartment in April was 14, and 16 for townhomes in the Fraser Valley region.
It took single family detached homes an average of 26 days on the market before selling.

HPI® Benchmark Price Activity
• Single Family Detached: At $1,009,200, the Benchmark price for a single family detached home in the Valley increased 0.8 percent compared to March 2018, and 13.5 percent compared to April 2017.
• Townhomes: At $549,900, the Benchmark price for a townhome in the Fraser Valley increased 1.5 percent compared to March 2018, and 23 percent compared to April 2017.
• Apartments: At $447,500, the Benchmark price for apartments/condos in the Fraser Valley increased 1.6 percent compared to March 2018, and 45.8 percent compared to April 2017.

Feel free to share this map and subscribe for more cool heat maps!

For more Lower Mainland Heat Maps – click here