I got tired of hearing “Vancouver prices are down” without anyone saying where.
So I mapped it.
This shows how prices changed in 2025, from December 31, 2024 to December 31, 2025, for condos, townhouses, and houses — neighbourhood by neighbourhood across Greater Vancouver. Same time frame everywhere. Same data rules.
What stood out immediately: the market didn’t move as one.
Some neighbourhoods were down double digits. Others barely moved. And in a few cases, prices actually grew by double digits.
Townhouses told a very different story. In several areas where houses dropped hard, townhouse prices were flat or even up a few percent — something you’d never guess from a city-wide headline.
Condos were the most uneven of all. Some neighbourhoods saw condo prices fall more than 10–15%, while nearby areas looked almost unchanged over the same year.
That pattern repeats across the map: same city, same year, completely different outcomes.
This is why averages don’t help much. They smooth out the parts that actually matter — especially if you own, are buying, or are thinking about selling in a specific neighbourhood.
If you want to know what actually happened in your area — not what happened “in Vancouver” — this map is the fastest way to see it.
Well butter my biscuits, have I got a treat for all you real estate enthusiasts out there! We are EstateBlock.com by Renanza Realty Inc. created a map of Lower Mainland, BC that’s so hot, it’s practically on fire!
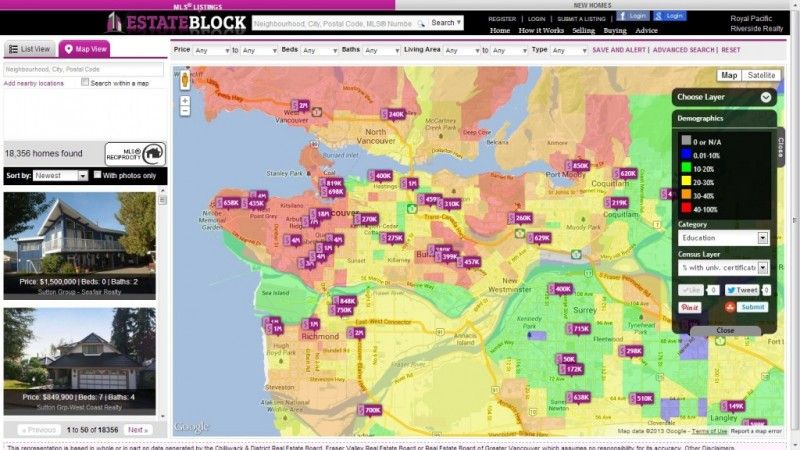
This map shows average real estate prices in different neighborhoods of Lower Mainland, color-coded like a heat map. You can easily see which neighborhoods are the most expensive (red hot!) and which ones are a bit more affordable (cool blue). And if you’re searching for a specific property type, no problem! You can use the search function to filter by property type and find exactly what you’re looking for.
But wait, there’s more! This map isn’t just informative, it’s also fun. It’s like playing a game of real estate roulette, trying to find the best deals and hottest neighborhoods. So, grab a cup of coffee, sit back, and get ready to explore the wild world of Lower Mainland real estate with this amazing map.
March 2023 Lower Mainland Real Estate Prices Map by Neighbourhood
Top 10 Most Expensive Neighbourhoods in Lower Mainland for Single Family Homes
1. $5.29M – Chartwell, West Vancouver
2. $4.97M – Shaughnessy, Vancouver West
3. $4.96M – Altamont, West Vancouver
4. $4.94M – Westmount WV, West Vancouver
5. $4.09M – Quilchena, Vancouver West
6. $4.05M – South Cambie, Vancouver West
7. $3.94M – South Granville, Vancouver West
8. $3.63M – Arbutus, Vancouver West
9. $3.52M – Kerrisdale, Vancouver West
10. $3.49M – Oakridge VW, Vancouver West
10 Least Expensive Neighbourhoods in Lower Mainland for Single Family Homes
1. $792K – Pender Harbour Egmont, Sunshine Coast, BC
2. $830K – Sechelt District, Sunshine Coast, BC
3. $877K – Gibsons & Area, Sunshine Coast, BC
4. $897K – Mission BC, Mission, BC
5. $914K – Bridgeview, North Surrey, BC
6. $920K – Dewdney Deroche, Mission, BC
7. $920K – Halfmoon Bay Secret Cv Redroofs, Sunshine Coast, BC
8. $944K – Central Abbotsford, Abbotsford, BC
9. $963K – Roberts Creek, Sunshine Coast, BC
10. $978K – Poplar, Abbotsford, BC
Top 10 Hottest Neighboourhoods in Lower Mainland Now, by Price appreciation in 1 Month, Single Family Homes
1. +9.8% – S.W. Marine, Vancouver West, BC
2. +9.7% – MacKenzie Heights, Vancouver West, BC
3. +9.6% – Southlands, Vancouver West, BC
4. +9.2% – Simon Fraser Univer., Burnaby North, BC
5. +8.9% – Sea Island, Richmond, BC
6. +8.3% – Stave Falls, Mission, BC
7. +8.3% – Chineside, Coquitlam, BC
8. +8.3% – Kerrisdale, Vancouver West, BC
9. +8.2% – Terra Nova, Richmond, BC
10. +8.1% – Hatzic, Mission, BC
Top 10 Neighboourhoods that are losing Value in Lower Mainland Now, by Price depreciation in 1 Month, Single Family Homes
1. -6.8% – Mount Pleasant VW, Vancouver West, BC
2. -5.7% – Cypress, West Vancouver, BC
3. -4.4% – Bear Creek Green Timbers, Surrey, BC
4. -4.3% – West Bay, West Vancouver, BC
5. -3.9% – Sumas Prairie, Abbotsford, BC
6. -3.7% – Serpentine, Cloverdale, BC
7. -3.4% – County Line Glen Valley, Langley, BC
8. -3.4% – Bayridge, West Vancouver, BC
9. -3.3% – Lions Bay, West Vancouver, BC
10. -3.2% – Mount Pleasant VE, Vancouver East, BC
Top 10 Neighbourhoods that appreciated in Value the Most in the last 3 years, Single Family Homes
1. 149.74% – Sea Island, Richmond, BC
2. 108.17% – Maillardville, Coquitlam, BC
3. 86.52% – Anmore, Port Moody, BC
4. 86.07% – Seafair, Richmond, BC
5. 76.11% – Forest Hills NV, North Vancouver, BC
6. 70.88% – Harbour Chines, Coquitlam, BC
7. 68.91% – Deer Lake, Burnaby South, BC
8. 66.92% – Tantalus, Squamish, BC
9. 66.09% – Westridge BN, Burnaby North, BC
10. 65.33% – Central Coquitlam, Coquitlam, BC
Top 10 Neighbourhoods that didn’t appreciate or Lost in Value in the last 3 years, Single Family Homes
1. -44.64% – University VW, Vancouver West, BC
2. -35.86% – Howe Sound, West Vancouver, BC
3. -10.18% – University Highlands, Squamish, BC
4. -8.74% – Mount Pleasant VW, Vancouver West, BC
5. -7.2% – Point Grey, Vancouver West, BC
6. -5.62% – Brennan Center, Squamish, BC
7. -3.24% – Horseshoe Bay WV, West Vancouver, BC
8. +0.69% – Westhill, West Vancouver, BC
9. +5.06% – English Bluff, Tsawwassen, BC
10. +5.58% – Strathcona, Vancouver East, BC
* Map and Reports are made using MLS® HPI Benchmark Price Stats Reports.
We are EstateBlock.com by Renanza Realty Inc. One of the most innovative real estate search engines in Canada powered by the one of the Best Real Estate agents in town. To get a Professional Market Evaluation done for you property, please click here
The search for the perfect home simplified: EstateBlock.com is helping Canadian homebuyers make sense of complicated data with its new house-hunting heat map technology. The new maps break down data such as demographics, crime statistics, service areas for schools and daycares, and even climate information into easy to understand color charts. EstateBlock home search tools are free.
“Searching for a new home on your own can be confusing,” says EstateBlock founder Vadim Marusin. “We’ve developed a simple technology to make the challenge of finding the right home easy.”
Using point-and-click navigation, buyers quickly filter the maps categories: Demographics, Crime, Schools, Daycares, Transit and Climate. The new real estate search engine is also equipped with advanced features that query information on local amenities such as banks, hospitals, grocery stores, parks and recreation. Buyers can also search by foreclosures, acreage and lot size, keywords, gross taxes and maintenance fees in a particular area.
Registered EstateBlock.com members can also use the Heat Map’s “save and alert” feature to receive e-mail notifications on specific queries and listings.
“The ‘right’ home is different for the individual buyer,” Marusin continues. “EstateBlock heat maps are sensitive to this reality.”
EstateBlock also offers a complimentary service to help potential buyers arrange home viewings. To search existing homes or new construction listings in Lower Mainland, B.C., or to enquire about homebuying or selling assistance, interested parties are encouraged to visit the following link: http://www.estateblock.com/.