


NEW
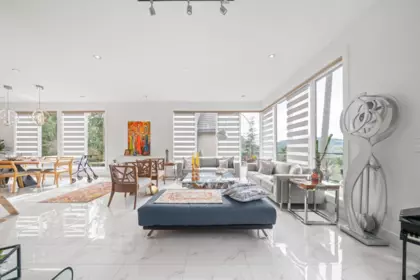
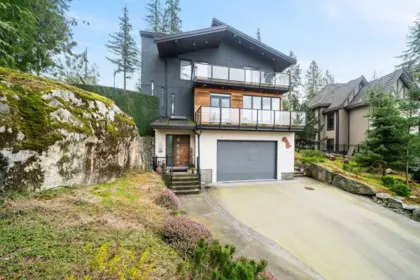
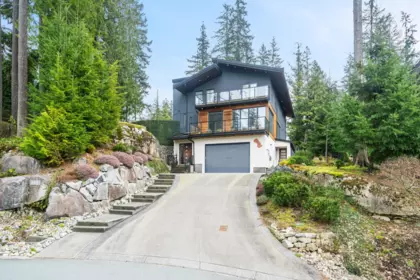
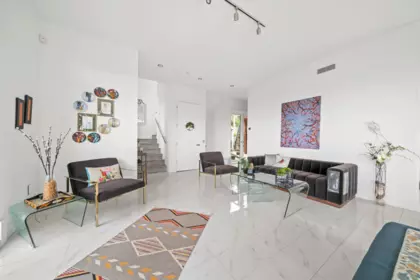
$3,180,000
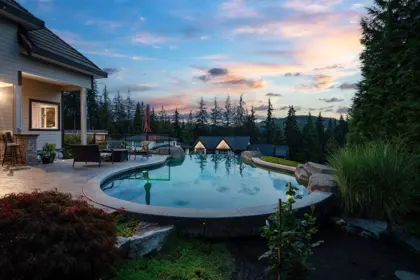
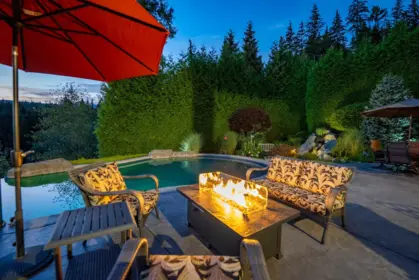
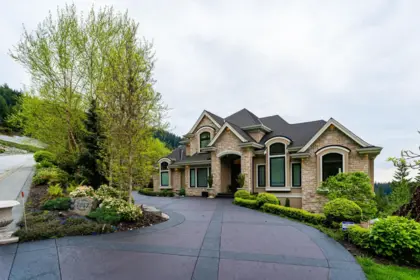
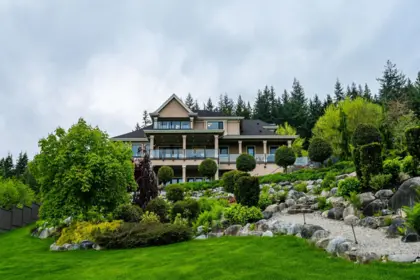
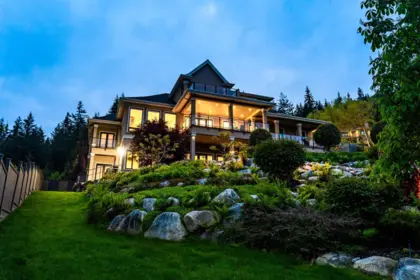
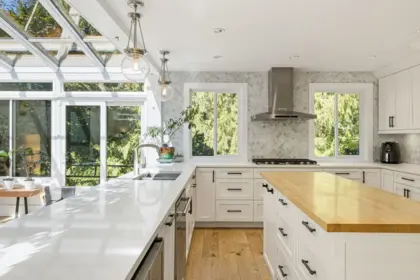
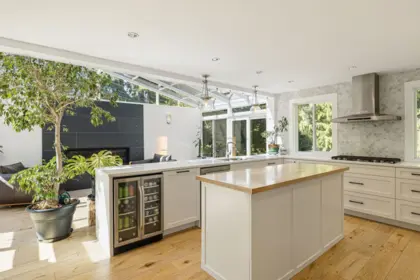
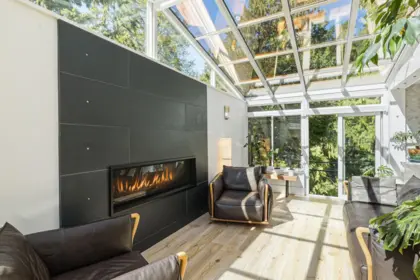
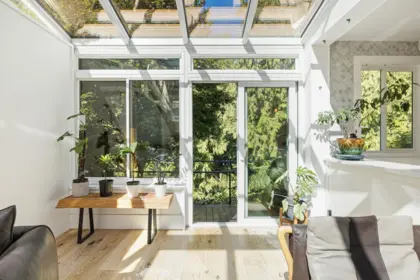
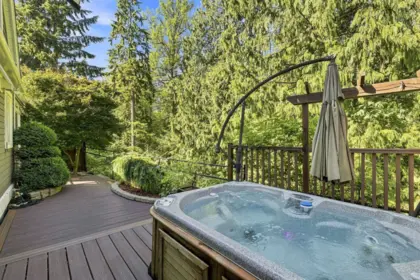
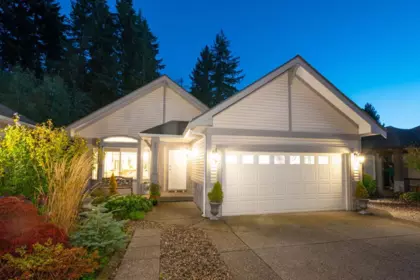
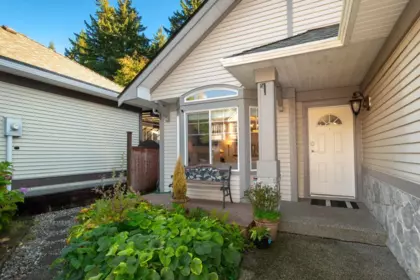
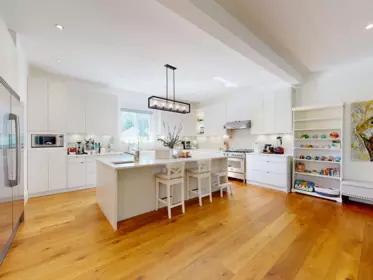
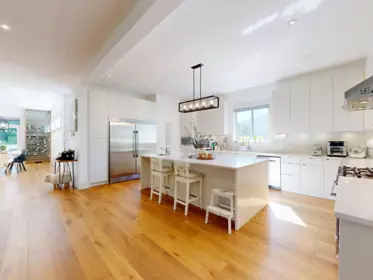
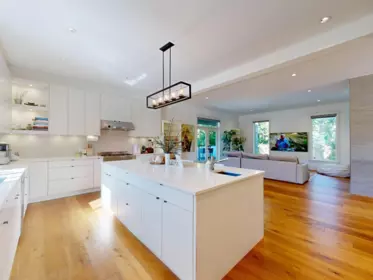
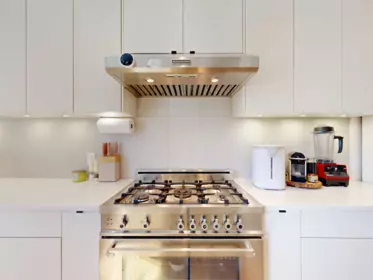
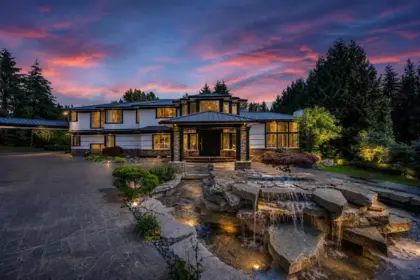
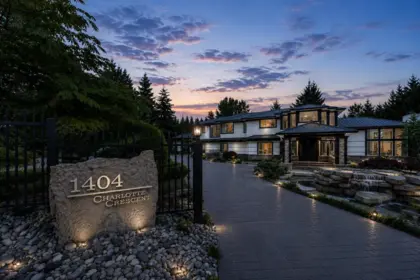
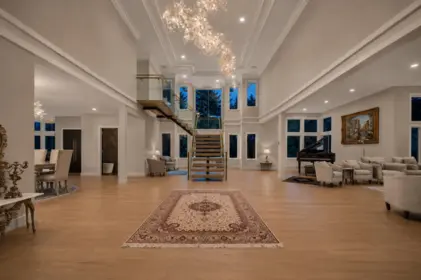
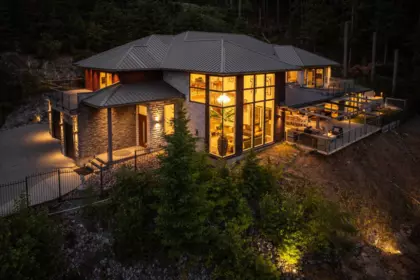
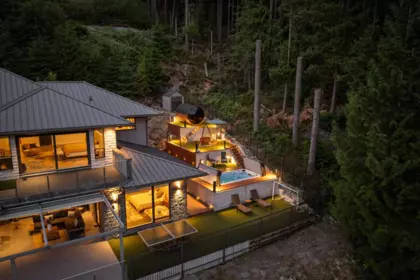
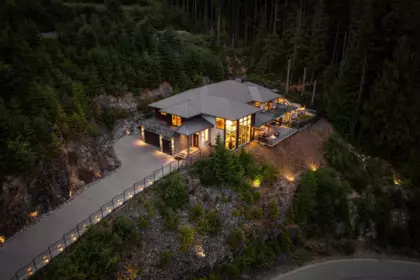
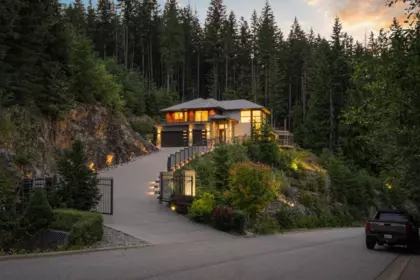
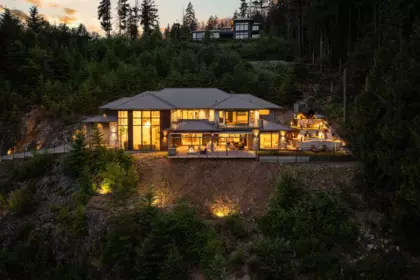
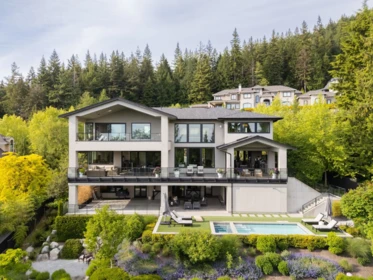
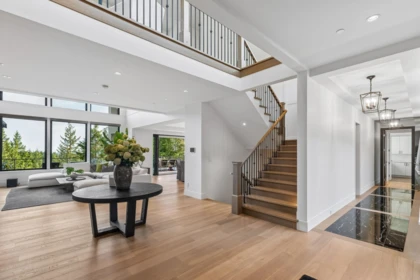
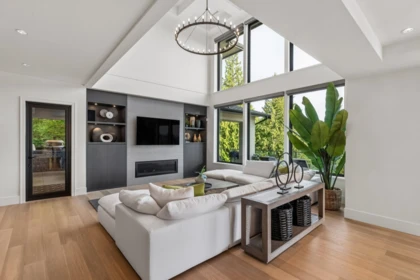
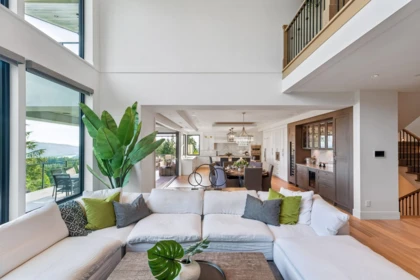
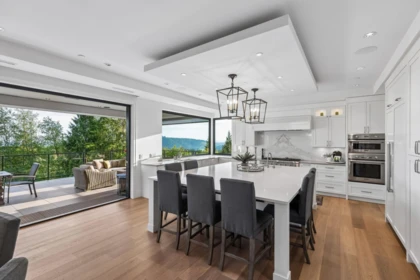
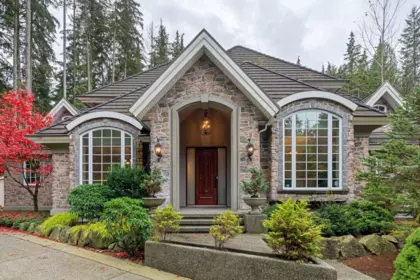
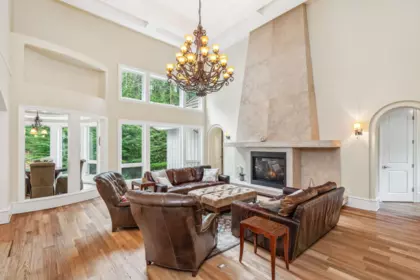
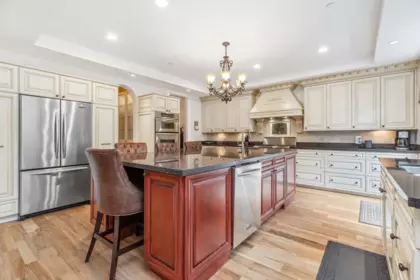
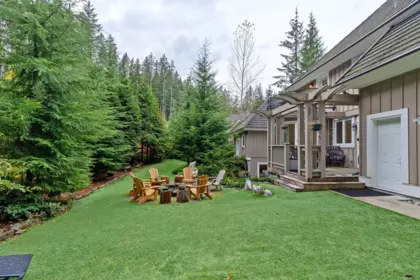
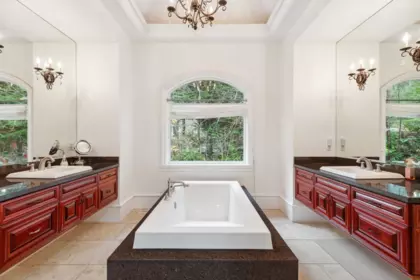
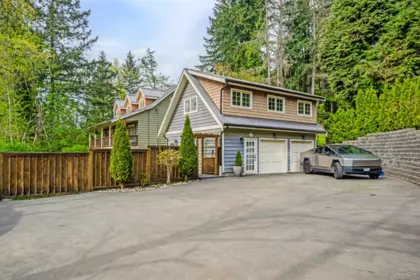
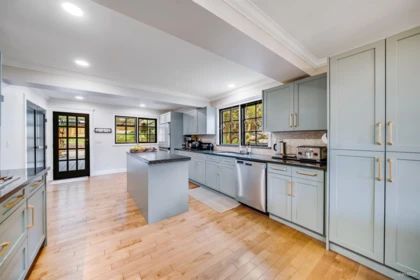
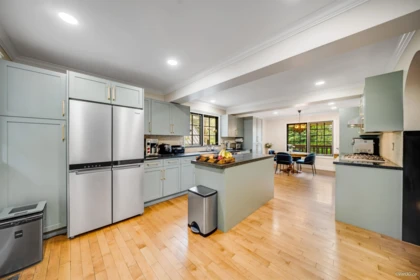
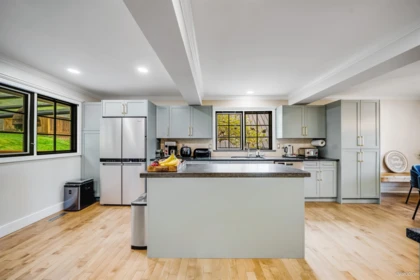
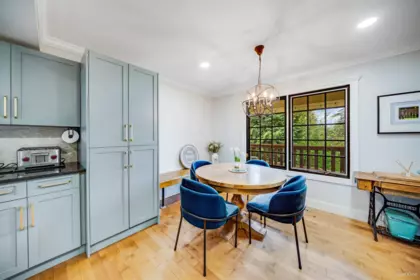
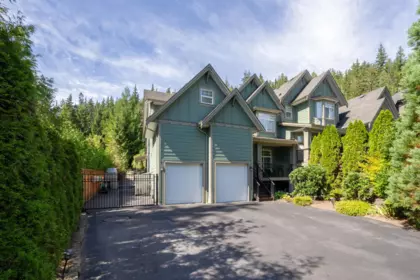
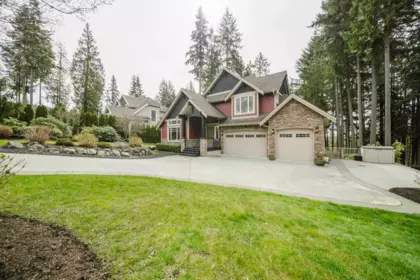
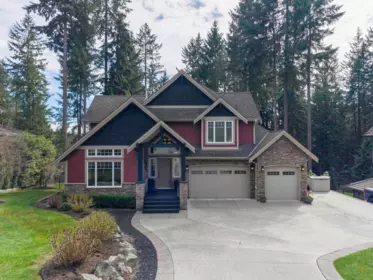
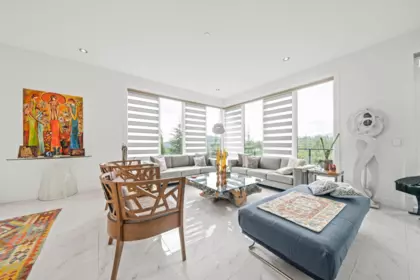
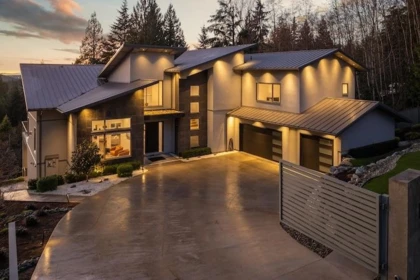
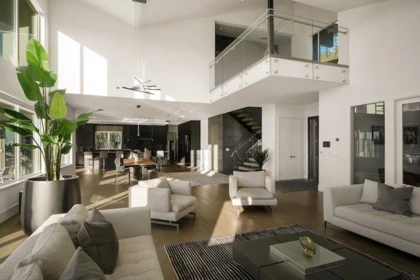
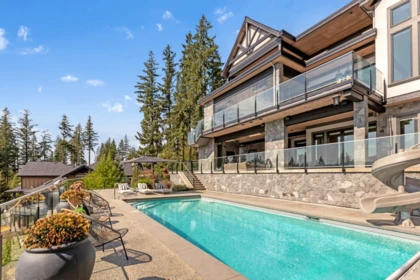
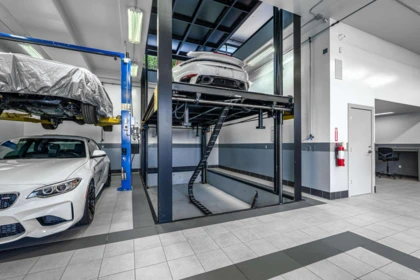
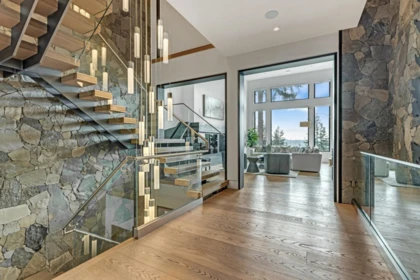
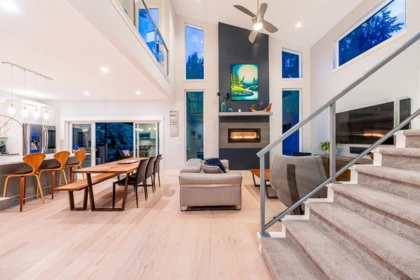
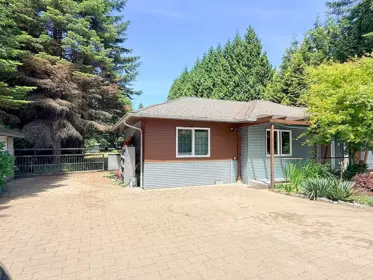
1408 Charlotte Crescent, Anmore, BC
5
Beds
5
Baths
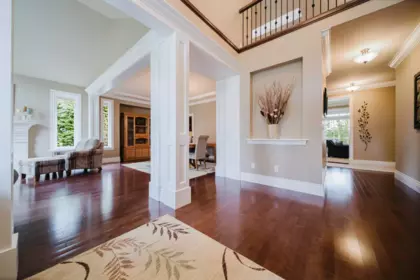
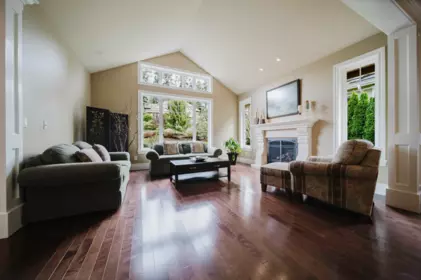
5930
sqft
1999
built

37 homes for sale in Anmore, BC · median list price $2,699,999 · 1 new this week · median 77 days on market (updated )
Market data & neighbourhood guide






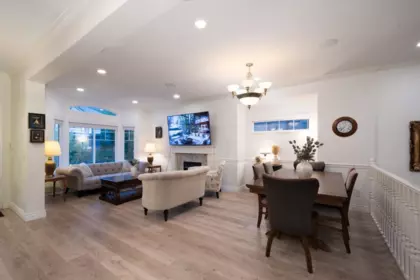
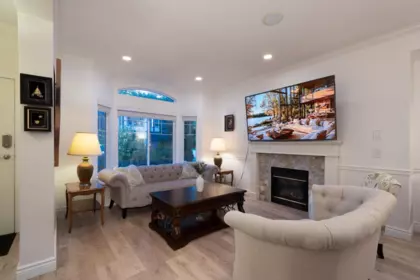
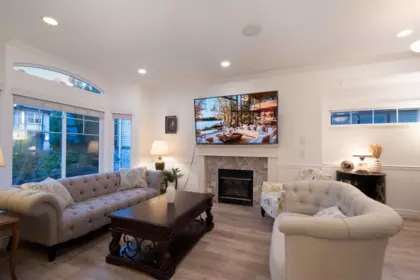
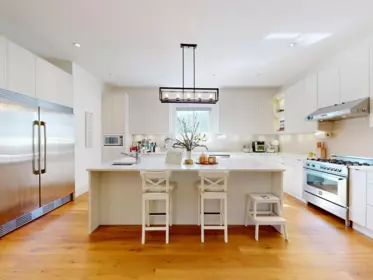



















Updated November 16, 2026.
36 homes are for sale in Anmore, BC: 27 houses. The median asking price is $2,924,450 ($640 per sqft). 4 listings have cut their price, by 5.7% on average.
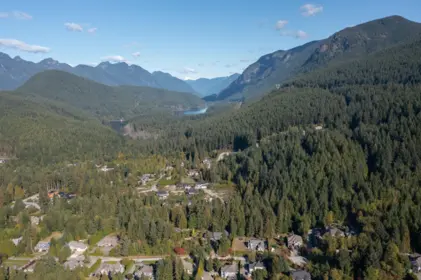
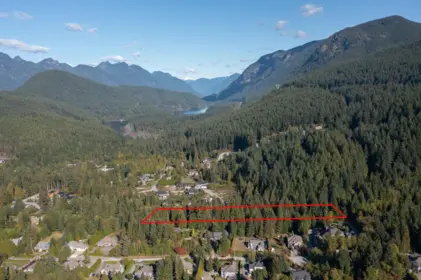
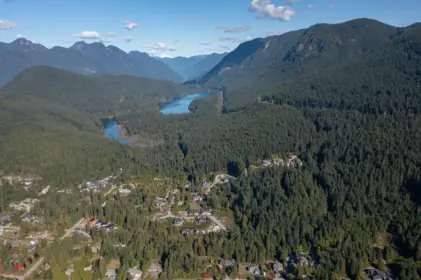
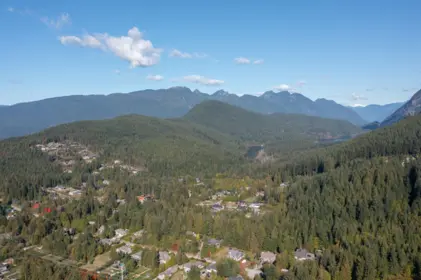
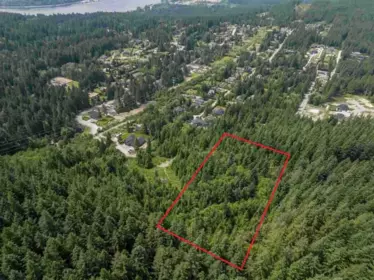
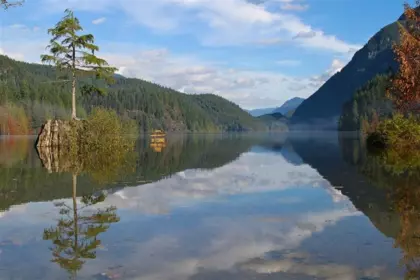
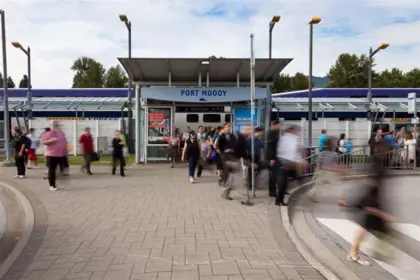
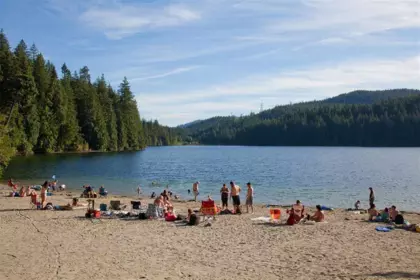
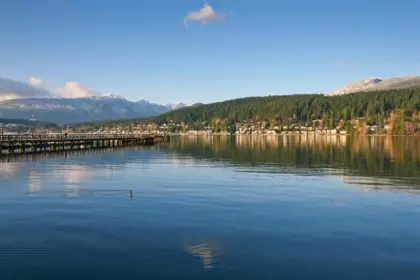
Anmore is a village of 2,356 people in the hills north of Port Moody, next to Buntzen Lake. Almost every property is a detached home on a half-acre to several acres, which makes it one of the most expensive areas on this site by median price. There is no transit; residents drive to the Evergreen SkyTrain stations in Port Moody.
Coquitlam RCMP (rural) recorded 4,668 crimes per 100,000 residents, rated Low. Violent crime is rated Low and property crime Below Average.
| Type of crime | Incidents | Per 100,000 residents | Level |
|---|---|---|---|
| All crime | 144 | 4,668 | Low |
| Violent crime | 19 | 616 | Low |
| Property crime | 75 | 2,431 | Below Average |
| Drug offences | 2 | 65 | Low |
| Traffic offences | 5 | 162 | Low |
| Other crime | 24 | 778 | Low |
Based on the latest available police-reported data behind our Crime map layer. It covers a whole police service area, not a single neighbourhood or address, and counts only crimes reported to police.
Median Walk Score 4 for homes for sale in Anmore.
The BC floodplain map our listing pages use does not cover Anmore, so there is no floodplain count here.
| Postal code | Wildfire | Air quality | Heat |
|---|---|---|---|
| V3H (37 homes) | Low | A / Excellent | Low |
Each grade is the one most homes for sale in that postal code get on their listing pages; "(12 of 40)" says how many of them get it, and a dash means their listing pages show no such grade. Heat is the projection for the 2050s under a moderate emissions scenario.
Source: BC Wildfire Service, provincial WUI Risk Class map, 2026.
Source: BC Air Quality monitoring network, Port Moody Rocky Point Park station, 2024 annual average.
Source: ClimateData.ca (PCIC / Environment and Climate Change Canada), 1981–2010 baseline, SSP2-4.5.
| Type | Homes for sale | Median price | Median per sqft |
|---|---|---|---|
| Houses | 29 | $2,999,900 | $622 |
| Other | 8 | $1,674,500 | $628 |
19% of the 37 homes for sale in Anmore, BC have had a price cut, by 5.1% on average.
3% of listings are priced below comparable sales.
1 homes came on the market in the last 7 days.
Homes sold for 95.7% of their asking price on average.
| Price range | Homes for sale | Share |
|---|---|---|
| Under $500K | 1 | 3% |
| $500K to $800K | 1 | 3% |
| $800K to $1.2M | 0 | 0% |
| $1.2M to $2M | 13 | 35% |
| Over $2M | 22 | 59% |
| Sold in the last 30 days | 1 |
|---|---|
| Sold in the last 90 days | 6 |
| Median sold price | $2,702,500 |
| Sold-to-list price ratio | 95.7% |
| Median days on market (sold) | 88 |
| Population (2021 Census) | 2,356 |
|---|---|
| Population (2016 Census) | 2,210 |
| Growth 2016 to 2021 | 6.6% |
| Municipality type | Village |
Anmore is a village of 2,356 people in the hills north of Port Moody, next to Buntzen Lake. Almost every property is a detached home on a half-acre to several acres, which makes it one of the most expensive areas on this site by median price. There is no transit; residents drive to the Evergreen SkyTrain stations in Port Moody.
37 as of Nov 16, 2026: 29 houses.
The median asking price for a detached house is $2,999,900.
7 of 37 (19%), with an average cut of 5.1%.
The lowest asking price is $475,000; the highest is $12,750,000.
Coquitlam RCMP (rural) recorded 4,668 crimes per 100,000 residents, rated Low. Violent crime is rated Low and property crime Below Average. These figures use the latest available police-reported data for a whole police service area, not for one street, and past incidents do not predict what will happen at any address.
The BC floodplain map our listing pages use does not cover Anmore, so it cannot tell which homes for sale in Anmore are in a floodplain. Before you buy, check the address with the municipality and your insurer.
Listing counts, prices and deal flags are calculated nightly from active MLS® listings on EstateBlock (last run November 16, 2026). Population figures are from the 2021 and 2016 Census of Population, Statistics Canada.
 Sold
Sold
Sold
Sold
Sold
Sold
