



NEW
$1,199,000
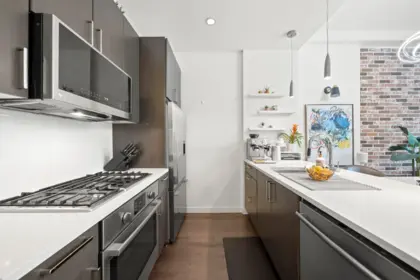
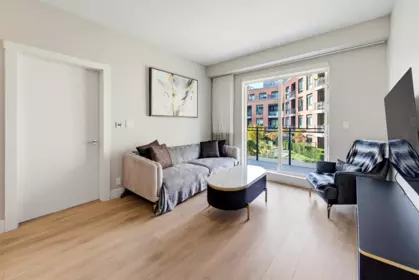
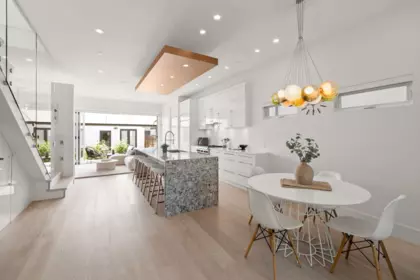
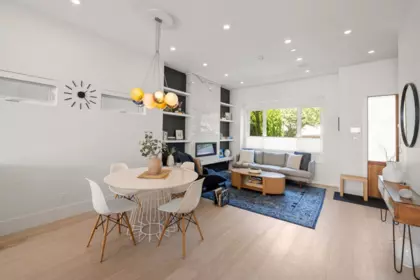
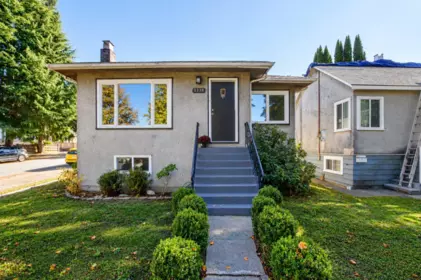
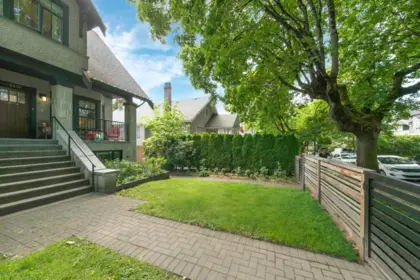
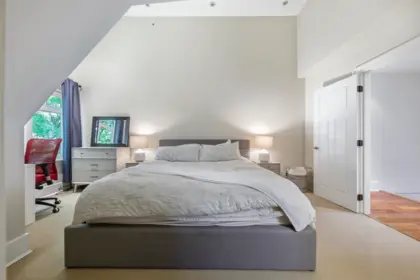
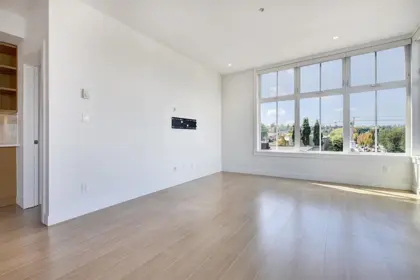
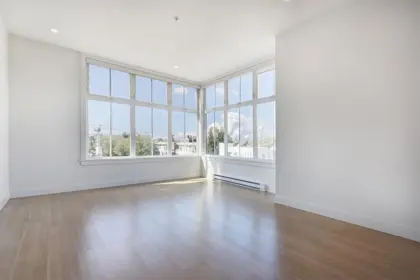
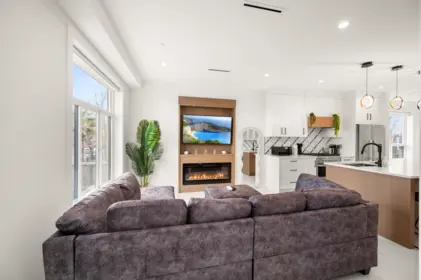
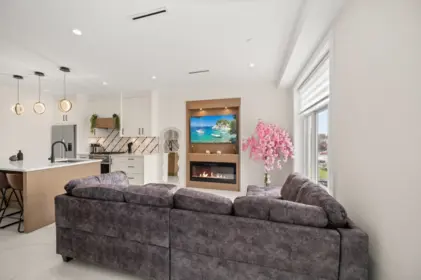
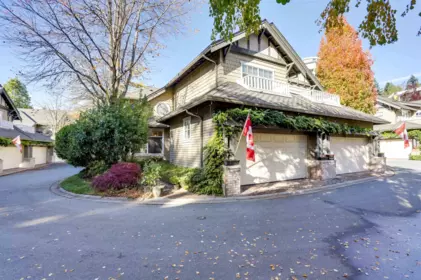
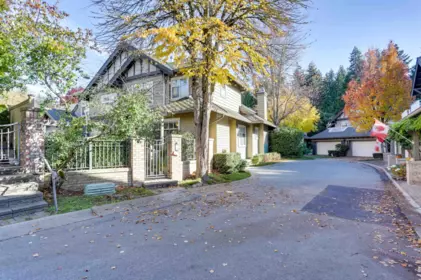
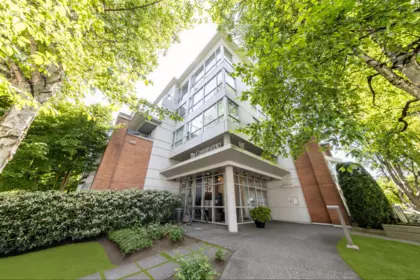
70 W 1st Avenue, Vancouver, BC
2
Beds
3
Baths
1141
sqft
2015
built








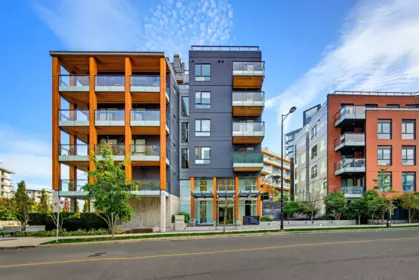
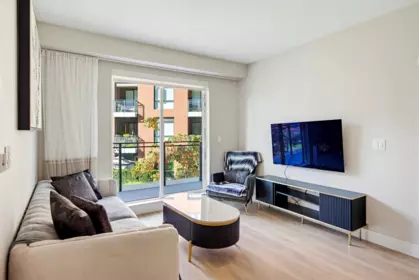
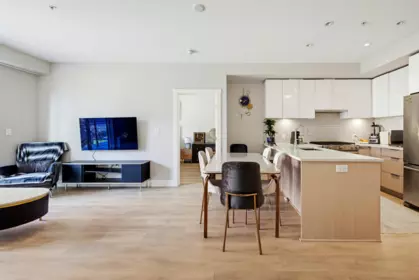
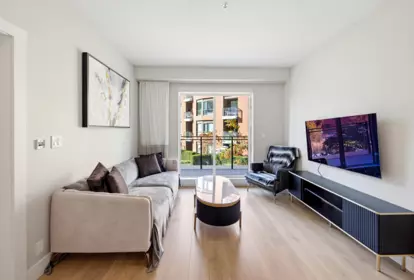


















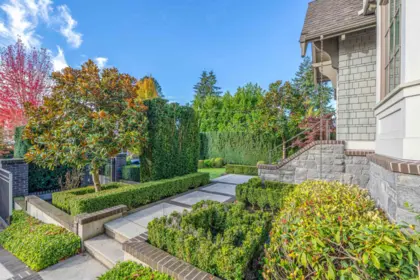
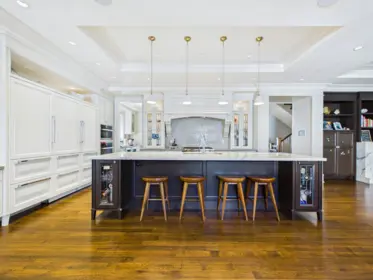
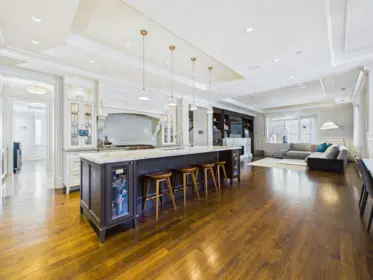


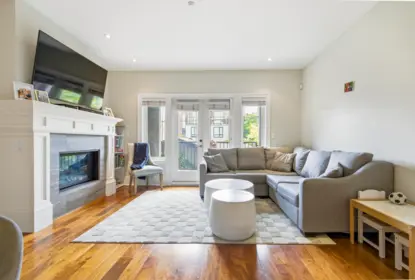











Updated October 22, 2026.
4,742 homes are for sale in Vancouver, BC: 1,369 houses, 2,306 condos, 530 townhouses. The median asking price is $1,389,950 ($1,028 per sqft). 333 listings have cut their price, by 9.7% on average.
| Type | Homes for sale | Median price | Median per sqft |
|---|---|---|---|
| Condos | 2,325 | $799,000 | $1,022 |
| Houses | 1,327 | $2,750,000 | $982 |
| Other | 560 | $1,788,000 | $1,068 |
| Townhouses | 520 | $1,398,800 | $1,036 |
| Neighbourhood | Homes for sale |
|---|---|
| Downtown VW | 383 |
| West End VW | 261 |
| Yaletown | 240 |
| Collingwood VE | 225 |
| Kitsilano | 213 |
| Cambie | 212 |
| University VW | 185 |
| Mount Pleasant VE | 176 |
| Grandview Woodland | 163 |
| Marpole | 163 |
| Renfrew VE | 141 |
| South Granville | 141 |
| Dunbar | 130 |
|---|---|
| Point Grey | 130 |
| South Marine | 127 |
| Fairview VW | 119 |
| Renfrew Heights | 119 |
| Fraser VE | 112 |
| Shaughnessy | 109 |
| Knight | 101 |
| South Vancouver | 100 |
| Kerrisdale | 98 |
| False Creek | 92 |
| South Cambie | 86 |
| Oakridge VW | 84 |
| Main | 82 |
| Victoria VE | 75 |
| Quilchena | 62 |
| Southlands | 31 |
| Mount Pleasant VW | 16 |
20% of the 4,732 homes for sale in Vancouver, BC have had a price cut, by 6.5% on average.
8% of listings are priced below comparable sales.
331 homes came on the market in the last 7 days.
Homes sold for 97% of their asking price on average.
| Price range | Homes for sale | Share |
|---|---|---|
| Under $500K | 274 | 6% |
| $500K to $800K | 990 | 21% |
| $800K to $1.2M | 842 | 18% |
| $1.2M to $2M | 1,300 | 27% |
| Over $2M | 1,326 | 28% |
| Sold in the last 30 days | 562 |
|---|---|
| Sold in the last 90 days | 1,904 |
| Median sold price | $1,140,000 |
| Sold-to-list price ratio | 97% |
| Median days on market (sold) | 91 |
| Population (2021 Census) | 662,248 |
|---|---|
| Population (2016 Census) | 631,486 |
| Growth 2016 to 2021 | 4.9% |
| Municipality type | City |
Vancouver is the largest city in British Columbia, with 662,248 residents in the 2021 Census, up 4.9% since 2016. It is a city of two halves. West of Main Street are the older detached neighbourhoods such as Kitsilano, Dunbar, Point Grey, Kerrisdale and Shaughnessy, where most homes sit on large lots and prices are among the highest in Canada. East of Main Street, areas such as Mount Pleasant, Hastings-Sunrise, Renfrew, Collingwood and Killarney have smaller lots, more duplexes and townhouses, and lower entry prices. The downtown peninsula (Downtown, Yaletown, Coal Harbour, the West End) is almost entirely condo towers and is where most of the city's listings are at any time. Transit shapes where people buy. The Expo and Millennium SkyTrain lines serve the east side and the Commercial Drive corridor, the Canada Line runs down Cambie Street to Richmond and the airport, and the Broadway Subway extension of the Millennium Line is under construction along Broadway to Arbutus. Homes within walking distance of a station hold their value best and sell fastest. Since the provincial Bill 44 rules, most detached lots in Vancouver can carry a multiplex of three to six units, which has changed how older houses on the east side are priced: the land value often matters more than the house on it. EstateBlock shows the assessed value and the lot size on every listing so buyers can see that difference.
4,742 as of the last update: 1,369 houses, 2,306 condos, 530 townhouses.
The median asking price for a detached house is $2,750,000; condos $799,000; townhouses $1,399,945.
Downtown VW with 383 listings, then West End VW with 261.
333 (7.0%), with an average cut of 9.7%.
The lowest asking price today is $58,000; the highest is $35,990,000.
Listing counts, prices and deal flags are calculated nightly from active MLS® listings on EstateBlock (last run October 22, 2026). Population figures are from the 2021 and 2016 Census of Population, Statistics Canada.
